Davis-Bacon Fringe Shortfall Impact on Labor Cost
Davis-Bacon fringe shortfall impact on labor cost is one of the most overlooked problems in construction pricing. When compliant hourly fringe is not met, the difference must move into wages. As a result, burden rises, wage-based fringe can rise, and true labor cost expands across the sold labor revenue stream.
What Davis-Bacon Fringe Shortfall Impact on Labor Cost Really Means
Under Davis-Bacon and prevailing wage rules, the compliant fringe requirement is set as an hourly amount. Therefore, even a strong annual benefits package may still create a compliance issue if the hourly equivalent falls short.
In that case, the contractor must add the difference to wages. Consequently, the labor model changes immediately. Payroll taxes now apply to a larger wage base. In addition, wage-sensitive fringe layers such as PTO and retirement match can also increase. For that reason, the Davis-Bacon fringe shortfall impact on labor cost is far larger than many estimators expect.
Direct Totals Recreated for Quick Executive Review
These recreated visuals bring back the direct totals view so the page shows both narrative and financial structure. In other words, readers can see how base labor, burden, fringe, and total loaded cost connect in one place.
| Component | Percentage (%) | Amount ($) | Count |
|---|---|---|---|
| Burden | 20.93% | 136,954.02 | |
| Fringe | 25.59% | 167,417.12 | |
| Burden, Fringe, Adjusted Fringe | 46.52% | 304,371.14 | |
| Hours | 17,056.00 | ||
| Hourly Labor Rate | 38.36 | ||
| Hourly Labor Rate With Burden/Fringe | 46.52% | 56.21 | 17.85 |
| Labor Revenue | 511,151.50 | ||
| Labor Revenue Shortfall (Davis-Bacon) | 143,191.62 | ||
| Labor Revenue With Shortfall | 654,343.12 | ||
| Labor Revenue With Burden/Fringe | 46.52% | 958,714.26 | |
| Employee Count | 8 | ||
| Employee Loaded Cost Average | 119,839.28 |
Davis-Bacon Fringe Shortfall Impact on Labor Cost Through Ripple Impact
Once fringe shortfall shifts into wages, ripple starts. First, taxable wage dollars increase. Next, burden rises. Then, wage-sensitive fringe can increase too. Therefore, the final cost effect is larger than the shortfall alone.
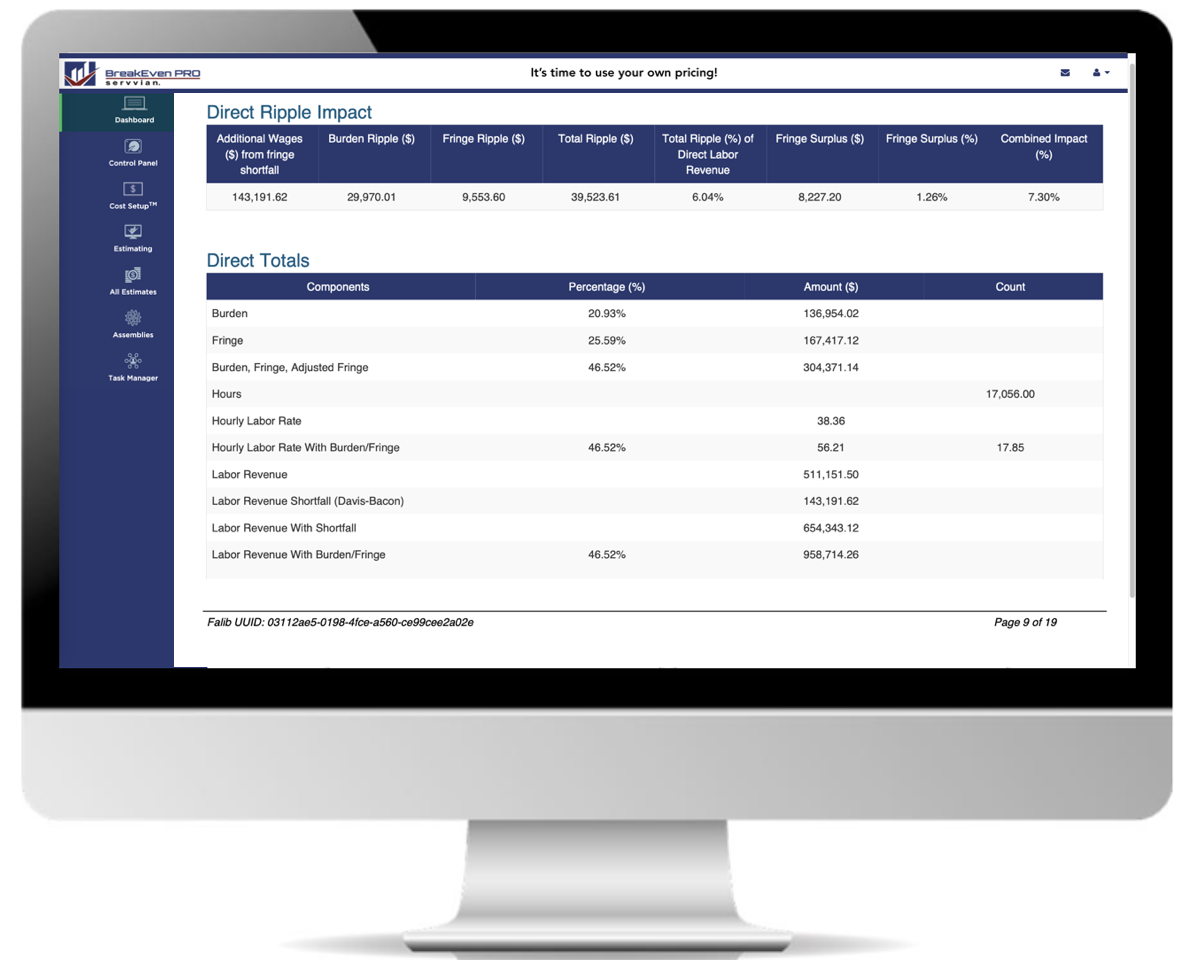
Ripple Breakdown Chart
This recreated chart shows how the direct shortfall creates a secondary burden and fringe ripple.
Adjusted Wages Recreated to Show the Wage Base Shift
This section brings back the adjusted wage table so the page clearly shows where the fringe shortfall is forced into direct wages. As a result, readers can see how a wage that once looked manageable turns into a much larger loaded cost position.
| Employee ID | Category | Total Hours | Avg Wage Rate ($) | Added Shortfall ($) | Adjusted Rate Avg ($) | Total Pay ($) |
|---|---|---|---|---|---|---|
| YIO-300 | Painting NOC | 2,150.00 | 31.40 | 10.32 | 41.72 | 89,698.00 |
| ABC-100 | Paint-Noc | 2,388.00 | 32.76 | 10.06 | 42.82 | 102,254.16 |
| JJJ-200 | Painting-NOC | 2,250.00 | 21.33 | 10.13 | 31.46 | 70,785.00 |
| PLO-301 | Painting NOC | 2,100.00 | 23.56 | 11.49 | 35.05 | 73,605.00 |
| LOU-302 | Painting NOC | 2,208.00 | 28.42 | 11.90 | 40.32 | 89,026.56 |
| Tally | $425,368.72 | |||||
Adjusted Wage Increase Examples
These recreated bars make the wage movement easier to scan visually.
Before the Wage Adjustment
Before the shortfall moves into payroll, burden calculations sit on a lower wage amount. Consequently, labor appears cheaper than it truly is.
After the Wage Adjustment
After the shortfall is forced into wages, payroll taxes rise, fringe can rise, and loaded labor cost expands. Therefore, pricing must account for the ripple or margins can get damaged.
Adjusted Fringe Recreated to Show Shortfall and Surplus
This recreated section restores the detailed fringe view, including both hourly deficiencies and surplus positions. That matters because some contractors need to add to wages, while others may need to review whether their benefit structure is overly inflated.
| Employee ID | Category | Total Fringe Cost ($) | Fringe per Hour ($) | Compliant Fringe Rate ($) | Difference Add to Wage Base ($) | Surplus Per Hour ($) | Total Surplus ($) |
|---|---|---|---|---|---|---|---|
| YIO-300 | Painting NOC | 20,809.42 | 9.68 | 20.00 | 10.32 | - | - |
| SPE-306 | Office | 17,833.08 | 8.57 | 20.00 | 11.43 | - | - |
| JJJ-200 | Painting-NOC | 22,216.67 | 9.87 | 20.00 | 10.13 | - | - |
| PLO-301 | Painting NOC | 17,881.09 | 8.51 | 20.00 | 11.49 | - | - |
| KEP-319 | Office | 22,165.00 | 11.19 | 10.00 | - | 1.19 | 2,356.20 |
| LOU-302 | Painting NOC | 17,894.10 | 8.10 | 20.00 | 11.90 | - | - |
| RPY-305 | Office | 24,878.68 | 13.09 | 10.00 | - | 3.09 | 5,871.00 |
| ABC-100 | Paint-Noc | 23,739.08 | 9.94 | 20.00 | 10.06 | - | - |
| Tally | $167,417.12 | $8,227.20 | |||||
Fringe Position Snapshot
This recreated chart highlights the difference between shortfall-driven wage additions and true fringe surplus.
How Wage Adjustments Expand True Labor Cost
The main problem is not just that more dollars are paid. The deeper problem is that those dollars are now treated as wages. Because of that, FICA, Medicare, and other burden costs are calculated on a higher base. Likewise, paid time off, retirement match, and other wage-based fringe elements may rise too.
For example, if a worker was originally priced near $32.00 per hour and fringe shortfall pushes that worker materially higher, the contractor may think the money simply moved from one bucket to another. However, that is not what really happens. Instead, the higher wage base can create a compounding increase in total labor cost.
Why General Contractors Also Feel the Impact
Subcontractors often feel this issue first, but general contractors are affected as well. If a subcontractor has a large fringe shortfall ripple, that cost will usually show up in the price they give to the GC. As a result, the GC receives a higher bid and may need to mark up an already inflated number.
On the other hand, if the subcontractor ignores the ripple and does not price it correctly, the subcontractor may win the job but damage margin later. In either case, the financial effect can move through the project chain and alter competitiveness.
How FALIB-Mr™ Solves Davis-Bacon Fringe Shortfall Impact on Labor Cost
FALIB-Mr™ gives end users the clarity to see fringe shortfall, adjusted wages, burden ripple, fringe ripple, and surplus conditions in one place. Then, it allows the user to re-run the report and gauge what must change to reduce or eliminate the ripple altogether.
Authoritative Davis-Bacon and Prevailing Wage Resources
For official Davis-Bacon and prevailing wage reference material, review the U.S. Department of Labor construction contracts guidance and the SAM.gov wage determinations resource.
Related SERVVIAN® Resources
Why Breakeven Is the Most Critical Number in Construction Bidding
Connect Davis-Bacon fringe shortfall impact on labor cost to breakeven visibility and bid discipline.
Financial IntelligenceFALIB®
See how SERVVIAN® surfaces true labor economics across burden, fringe, and compliance-driven pricing.
GovCon ResourceWhat Is G&A Rate in GovCon?
Connect labor cost structure to broader government contracting overhead and pricing strategy.
GlossaryFringe Shortfall
Use glossary autofill search to support internal linking and topic depth.
GlossaryPrevailing Wage
Help readers and search engines connect this post to the compliance vocabulary around wage determinations.
PlatformBreakEven+™
Explore the broader SERVVIAN® platform for estimating precision and true labor cost visibility.
Go Here for Pricing
Want to see SERVVIAN® pricing and take the next step toward better labor cost clarity, breakeven precision, and Davis-Bacon visibility?
View Pricing