For the astute contractor®, stop underbidding or overbidding your jobs.
Gain the peace of mind that comes from pricing with your real labor, materials, overhead, and profit goals. BreakEven+™ helps you stay up to date with changing costs, remove the guesswork from estimating, and build accurate estimates around how your business actually runs.
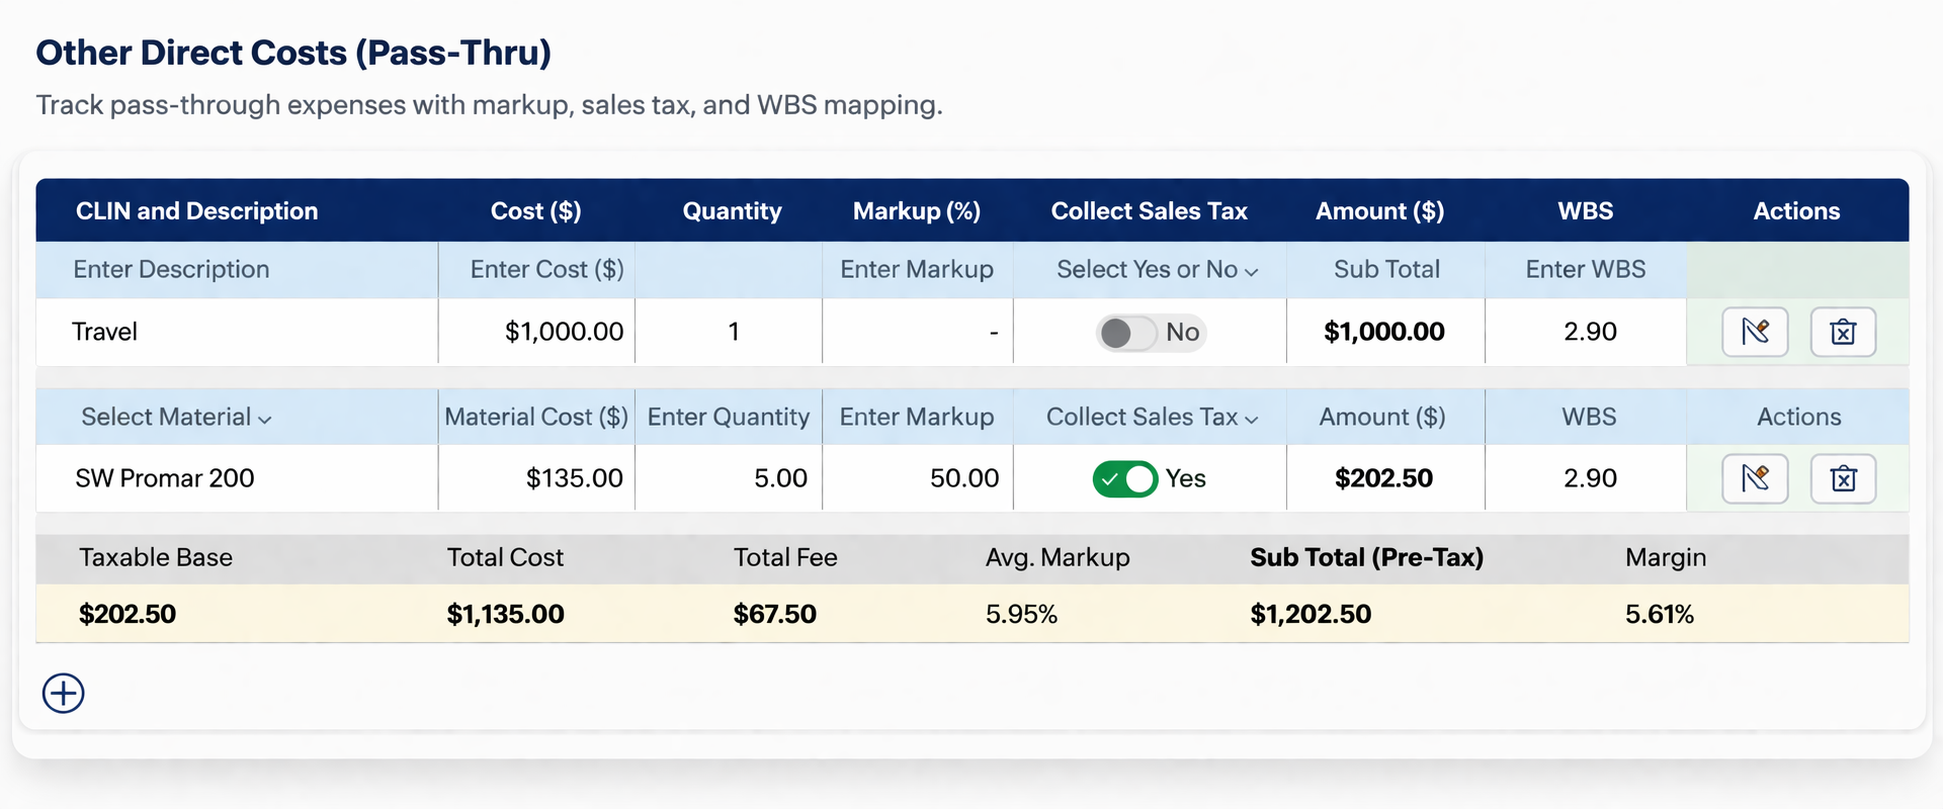
First enter all of your costs, then mark up your profit.
No two contractors have the same wages, budgets, support costs, or operating overhead. BreakEven+™ is built to reflect that. You can load your direct labor costs, indirect costs, off-the-clock support time, and business overhead so pricing starts from your numbers, not someone else’s.
That means customer service time, administrative labor, and operating overhead do not need to stay hidden. Once the full cost structure is loaded, you can mark up profit with more confidence and see the true impact on your hourly sell rates, unit rates, and estimate totals.
The result is simple to understand: recover the real cost of doing business first, then apply the profit expectation you want. That is a much safer way to price work than borrowing a rate from another company or relying on stale assumptions.
Populate the structure around how your company actually spends, supports, and operates.
Update labor costs, budgets, or profit goals and see the pricing view move with your data.
Load the full cost picture first, then layer markup and margin where they belong.
One clean view of breakEven, sell rate, pass-through profit, and total margin.
This table is designed to make the pricing model readable. A contractor should be able to scan the structure, understand where labor profit is added, see how pass-through profit is handled, and follow how G&A behaves under different base views.
| Components | Percentage (%) | Hourly Rate ($) | Amount ($) |
|---|---|---|---|
| Total Gross Revenue (Includes COM) | 31,041,309.68 | ||
| BreakEven RATE | 76.83 | ||
| Labor Profit Markup (Fee) | 11.11 | 855,826.44 | |
| Labor Profit Margin (Fee) | 10.00 | 8.54 | |
| Hourly Sell Rate | 85.37 | ||
| Pass-Through Components | 21,190,000.00 | ||
| Pass-Through Profit (Blended Markup) | 5.99 | 1,269,100.00 | |
| Total Cost Input (TCI) → G&A Rate | 8.58 | 26,609,129.21 | |
| Value-Added Base (VAB) → G&A Rate | 16.48 | 13,860,050.18 | |
| Combined Profit Amount | 2,124,926.44 | ||
| Combined Profit Markup | 7.35 | ||
| Combined Profit Margin | 6.85 | ||
| Final Net Margin (After Unallowables) | 6.75 | 2,093,426.44 |
The road to success is easier to navigate with the right tools.
The BreakEven+™ FALIB™ Report supports Forecast Analysis for Labor Intensive Businesses by tying overhead reporting and profit allowance into one working view. Once the report is saved, man-hour sell rates and unit rates can update automatically in BreakEven+™.
Refresh direct labor costs, indirect costs, budgets, and operating assumptions as conditions change.
Capture the forecasted overhead and profit allowance in a report that supports how you actually price work.
Labor-hour sell rates and unit rates can update automatically so your estimate logic stays aligned.
Recover current overhead, reflect forecast profit goals, and price work with clearer control over margins.
Built for estimating, job control, access control, and day-to-day operations.
BreakEven+™ is more than one rate calculator. It supports estimating, contracts, work orders, invoices, document management, production logic, attendance visibility, and user access control across the people and records that keep your jobs moving.
Admins can control what each user can list, view, create, edit, delete, import, or export across key modules like employees, files, reports, estimates, work orders, settings, and more.
Track and manage estimates, proposals, change orders, work orders, contracts, and invoices so the right records stay tied to the right job.
Organize supplier-based material data with coverage, waste, markup, and pricing details to calculate true cost of goods sold.
Define crew productivity by task so labor time and labor cost can be estimated with more consistency and accuracy.
Keep project contacts centralized and aligned with role-based permissions so every user sees what they need and no more.
Employees can populate time cards on the go while employers track time and reporting in real time from one system.
What is your BreakEven RATE?
BreakEven+™ helps you answer that question with your own company data. The example on this page may look useful, but it should never replace your real cost structure. Being able to update labor, overhead, and profit goals in real time gives you more control over pricing than relying on someone else’s numbers.
Increase or decrease profit markup when you need to. Forecast your current costs and budgets. Populate hourly sell rates and unit rates from the reporting structure behind the estimate. That is how pricing gets more accurate, whether you are estimating a small residential job or an 80-story building.
This same logic works whether you perform field takeoffs or digital takeoffs from plans and drawings. The goal is simple: estimate with your costs, not someone else’s.
Accuracy and efficiency are only moments away.
Build estimates with your costs, your overhead, your forecast, and your profit goals. When breakEven, sell rate, pass-through support, and margin all stay visible, the road to better pricing gets much easier to navigate.