BreakEven+™ for Municipal Water & Wastewater

Know what utility work is expected to cost before the budget is committed.

Forecast labor, fringe, overhead, G&A, support, materials, subcontractors, and project costs—then use FALIB® reporting to make the assumptions behind the number easier to explain.
Treatment Operations Maintenance & Field Crews Forecast Budgets
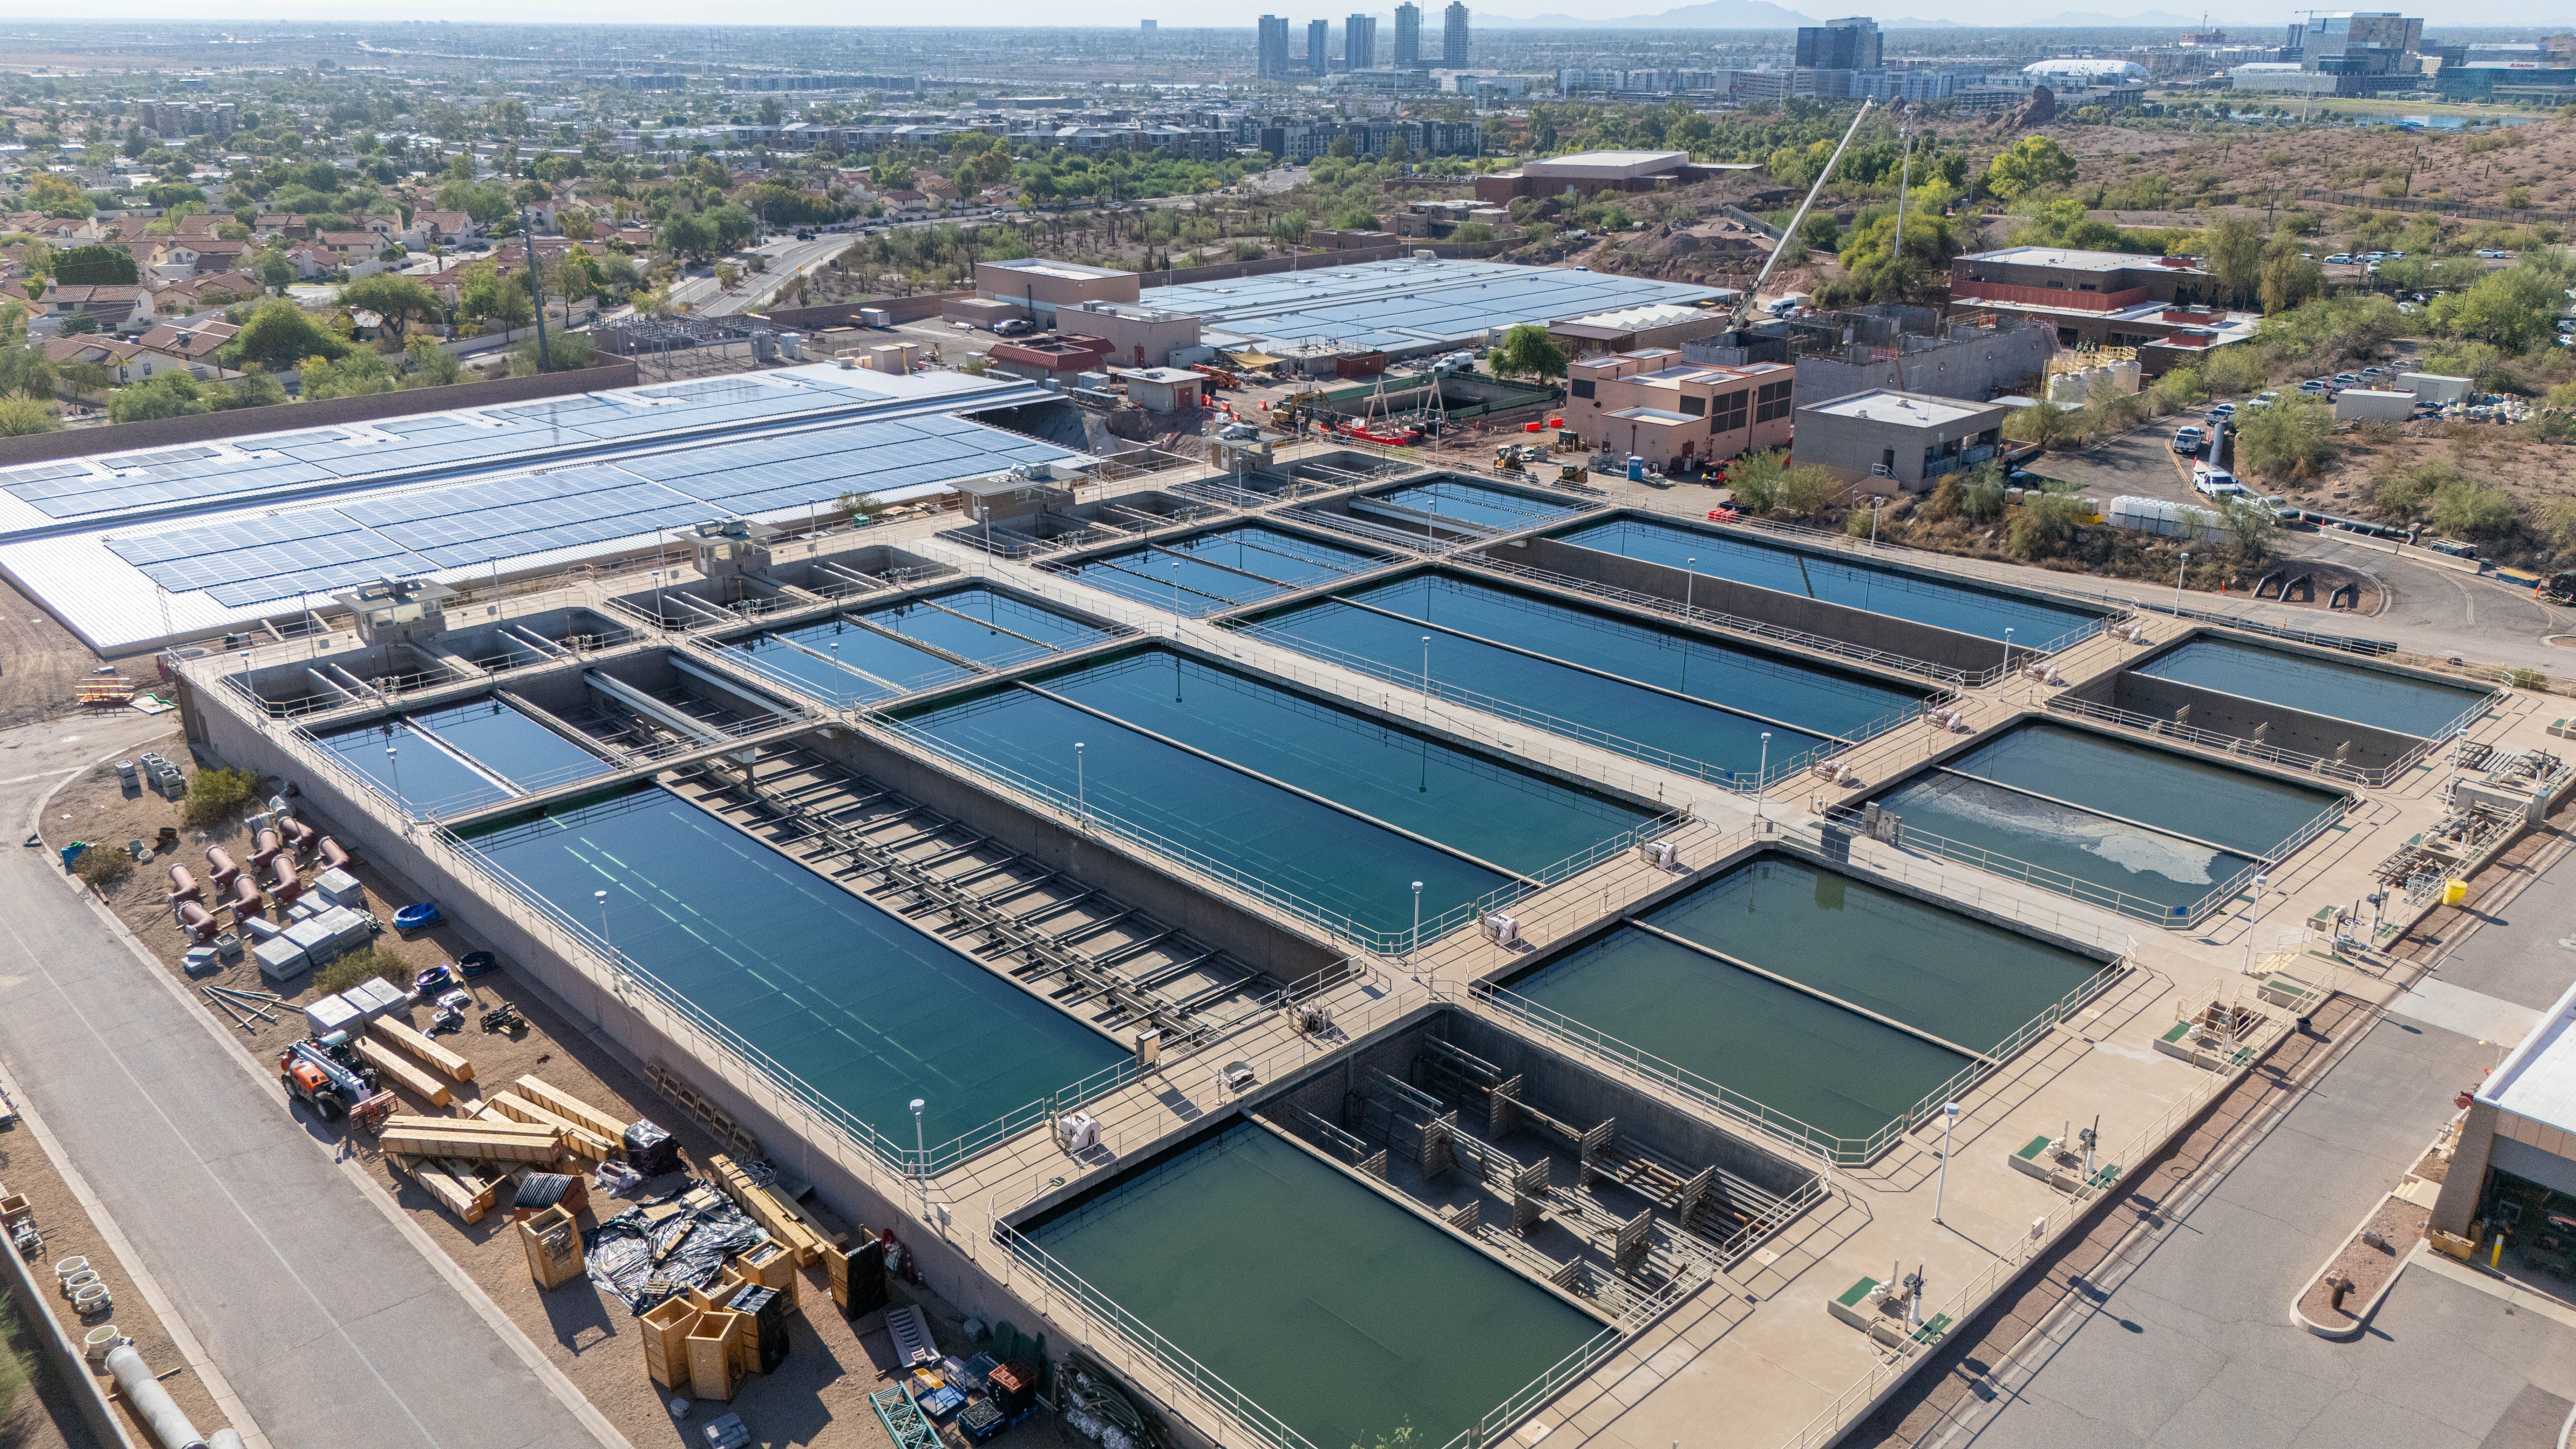
Aerial view of a municipal water treatment facility representing BreakEven+ cost intelligence for public utilities
Why this matters

A plant budget tells you the total. BreakEven+™ helps show what is driving it.

Treatment operations depend on people, maintenance, administration, support, materials, outside services, and infrastructure. A forward-looking cost model makes those layers easier to plan before the budget or project estimate is finalized.

What is one productive hour of utility labor really carrying?

Not just wages. It may also need to support fringe, supervision, plant overhead, broader administration, and other indirect resources.

That is the cost story FALIB® helps make visible.
Built for utility operations

Use your own labor and cost structure—not a generic industry rate.

Municipal utilities can model the people and support resources they actually expect to use. That can make annual operating plans, maintenance budgets, and internally performed project estimates easier to explain.

01

Direct labor

Operators, mechanics, electricians, field crews, technicians, and other employees performing direct work.

02

Indirect support

Supervision, planning, administration, facilities, systems, and other resources supporting direct activity.

03

Project inputs

Materials, outside services, subcontractors, ODCs, and production assumptions connected to the work.

04

Budget visibility

Carry the forecast into reports that help explain what the proposed operating or project budget is expected to support.

Illustrative utility model

See how labor hours and cost pools build into an annual utility budget.

The example below is illustrative only. It connects budgeted labor hours to direct wages, fringe, overhead, administration, and support so visitors can see both the hourly planning logic and the annual budget structure.

$0.00Illustrative direct wage mix per productive hour
$0.00Illustrative fringe and payroll burden
$0.00Illustrative overhead and support allocation
$0.00Illustrative fully supported planning rate
Illustrative annual operating model $0.00M

Instead of hiding everything inside one percentage, separate the pools so management can see what is driving the forecast.

Budgeted Direct Labor Hours 0 Illustrative hours supporting the $1.42M direct-wage forecast at the $38.40 blended direct wage.
Budgeted Support / Indirect Labor Hours 0 Illustrative support hours represented by the $244K support-labor pool using the same example blended wage assumption.
Direct wages$1.42M
Fringe / burden$548K
Department overhead$686K
General administration$392K
Support labor / operations$244K

Illustrative values are not utility benchmarks, incurred-cost results, accounting guidance, or recommended rates. Actual configuration depends on the utility's own labor, budgets, allocation methodology, policies, and financial records.

Potential efficiency beyond the rate calculation.

The value is not only seeing an hourly planning rate. A reusable cost model can also reduce repetitive budget-building work and make more of the cost logic available internally.

Potential operational benefit
Less spreadsheet rebuilding Reuse configured labor, indirect pools, productive-hour assumptions, and reporting logic instead of reconstructing the same cost build for each budget cycle or estimate.
Faster scenario testing Change labor, productive hours, pool values, materials, or project assumptions and review the effect without rebuilding the entire model from the beginning.
Potentially less outside modeling work When appropriate internal staff can maintain the forecast, a utility may reduce reliance on outside resources for recurring cost-model preparation or routine scenario updates.

Actual time or cost savings vary by organization, existing processes, staffing, data quality, configuration, and the scope of any outside professional services. BreakEven+™ does not guarantee a specific savings amount.

Municipal water and wastewater operator monitoring treatment operations representing BreakEven+ cost intelligence
From treatment to project

Carry the same cost logic into maintenance and capital work.

A utility may use internal employees for plant maintenance, collection or distribution work, repairs, rehabilitation, or portions of a capital project. BreakEven+™ can carry the underlying labor and indirect-cost assumptions into an estimate so the project view remains connected to the same forecast structure.

  • Estimate direct employee hours using the same forecast labor foundation.
  • Keep supervisory and support labor visible instead of burying it in one markup.
  • Add materials, subcontractors, and ODCs without losing the labor-cost logic.
  • Use production assumptions to translate quantities into labor-hour requirements.
  • Test changes before the budget or estimate is finalized.
Where it can help

One cost-intelligence framework across utility operations.

Treatment operationsForecast operators, maintenance, supervision, administrative support, and planned operating costs.
Preventive maintenanceBuild labor and support assumptions around recurring maintenance programs and scheduled work.
Distribution & collectionModel field crews, support, materials, and project inputs for line, main, and system work.
Plant rehabilitationConnect internal labor, subcontractors, materials, and indirect support to rehabilitation estimates.
Capital planningDevelop forward-looking cost assumptions before projects move into a committed budget.
Budget explanationGive finance and management a clearer picture of what a proposed utility budget is expected to support.
FALIB® Reporting

Choose the reporting depth that matches the utility's planning needs.

FALIB® connects the forecast foundation to project and production detail so a utility can keep the cost logic organized as planning moves forward.

Employee-level foundation

FALIB®-Mr

Use employee-specific wages, fringe, classifications, and labor assumptions when greater detail is needed.

Explore FALIB®-Mr →
Grouped foundation

FALIB®-Sr

Model labor by role, department, classification, crew, or other strategic grouping.

Explore FALIB®-Sr →
Project view

FALIB®-Jr

Carry the originating cost structure into a specific estimate or change so the project remains explainable.

Explore FALIB®-Jr →
Production detail

FALIB® P&P

Show production, labor hours, materials, unit rates, quantities, and project-level detail behind planned work.

Explore FALIB® P&P →
Consolidated view

FALIB® Roll-Up

Bring accepted estimates and changes into a new summarized financial view while keeping source records intact.

Explore FALIB® Roll-Up →
BreakEven+™ by SERVVIAN®

Give water and wastewater budgets a clearer cost foundation.

Forecast the labor. Separate the indirect pools. Estimate the work. Then use FALIB® reporting to explain the assumptions behind the number.